Article Navigation
PRACTICAL TROPOSPHERIC MODEL FOR VHF/UHF PROPAGATION PREDICTION
Vincent J. Biancomano and Scott W. Leyshon
Abstract
Using an algorithm based on atmospheric persistence, stability, and the tracking of air parcels through the mechanism of potential temperature, this model provides a regional, i.e., group, accuracy as high as 70 percent to predict tropospheric conditions suitable for enhanced very-high and ultra-high frequency (VHF and UHF) radio communications approximately 8-12 hours in advance for the eastern half of the US. The model, which utilizes the twice-daily soundings of radiosonde data readily available on several web sites (827 data sets for each of approximately 50 stations over 1995-1997), focuses on large-scale meteorological systems that support enhancement and ducting of radio frequency signals, in contrast to models that provide specific radio path analysis or calculate signal strengths that would accrue as a result of climatologically-based predictors, or known (post priori) tropospheric conditions, respectively. Thus it serves to predict general conditions for enhancement over a broad geographical area.
1. Introduction
Enhancement and ducting of radio signals at VHF to microwave frequencies due to tropospheric bending, i.e., propagation beyond the usual distances, has been traditionally of interest to radio amateurs and the military, and may also be of concern to those utilizing short-range VHF and UHF commercial communications links. The prime objective for radio amateurs is to extend communi-cation distances beyond so-called normal line of sight paths. That goal is often in direct contrast to the needs of the military and commercial contingents, where the range must of necessity be bounded in order to provide secure communications and to avoid interference with other services. This model will provide results sufficient to meet the needs of radio amateurs in their propagation studies, and may also be of interest to military and commercial users, depending on their requirements and the proprietary diagnostic tools already available to them.
Formulation of a practical model for the everyday user, a major goal of this study, has been made possible by the Internet itself, which on the World Wide Web provides twice daily soundings of upper air conditions free of charge for more than 80 stations in the US, Canada, and Mexico. Various radio propagation tools, especially for ionospheric propagation at HF frequencies, have appeared from time to time from various sources, with some now appearing in freeware on the Internet. However, available programs for propagation prediction at VHF and UHF frequencies, where tropospheric conditions are prominent, are sparse and often not easily secured or applied. No known programs take advantage of the aforementioned radiosonde data. Marcus and Stuart (1981), for example, developed a model to calculate the electromagnetic field of signals passing through a tropospheric duct. Recently available programs offered through the Internet include the US Navys Ducting Climatology Survey (1992), a climatology database of atmospheric ducting conditions for use in assessing electromagnetic wave propagation. Also available is a US Navy program for Radio Propagation Over Terrain Model (1996) for PC platforms using the Windows 95 operating system. It uses a combination of the Terrain Parabolic Equation Model (TPEM) and the Radio Physical Optical (RPO) model to compute and display radar probability of detection and/or Electronic Support Measure (ESM) vulnerability of communications capability versus height, range, and bearing from the source. In contrast, our program utilizes twice-daily upper air soundings (tabular form) now provided at several sites on the World Wide Web, making it possible in a simple fashion to analyze tropospheric conditions in real time. This model predicts the potential for the enhancement of VHF/UHF radio signals across the east, central, and southern US, where reported activity is highest (QST, 1946-present), and analysis is unencumbered by mountainous regions. This model has provided sufficiently accurate results, based on results using 827 sets of data for each of more than 50 stations (47 stations ultimately used in this study), in determining the propensity for air mass systems of relatively large dimension to extend the normal range of VHF/UHF radio propagation. This success occurs even considering the temporal and spatial sparsity of data in the twice-daily balloon soundings across the country and often a scarcity of data between levels of a given sounding.
Choice of the VHF/UHF frequency range of interest, in this case the 144 MHz-432 MHz region, has not been arbitrary. First, the highly-occupied 144 MHz frequency at VHF, the 222 MHz band, and the 432 MHz band at UHF are allocated to the Amateur Radio Service, where propagation experiments at the lower VHF frequencies starting at 56 MHz have been conducted for more than 60 years (Hull 1935) and continue to be investigated, and where confirmation of predicted ducts, or openings, can be secured with relative ease. Second, the ultimate accuracy of a sounding is determined by the rate of rise of the balloon and various time-constant delays and variations in the response of temperature and humidity instruments that are a function of temperature. This strongly indicates that atmospheric profiles of temperature and humidity over tens of meters in depth (for VHF/UHF), rather than small perturbations in these variables over meters or even centimeters into the microwave range, can more positively be detected and more accurately mapped. Third, while only about 5 percent of all surface ducts occur at a frequency as low as 144 MHz (Bean and Dutton 1966, p. 140-145), the waveguide characteristics of a duct generally enable the fundamental signal frequency and higher to propagate along it for great distances with minimal attenuation. Thus, with the lowest bound at the VHF frequencies, extended propagation at higher frequencies can also be inferred. This technique has long been used in practical work by radio amateurs to determine the suitability of higher frequencies for extended communication, where total path losses are frequently lower (curiously, the reverse technique, i.e., working from the higher to lower frequencies, is not applied because it is generally much more difficult to aim directional antennas at an intended target as the frequency increases. A search for known signals at the higher frequencies is thus undertaken once the virtual certainty of extended propagation at the lower frequencies has been established).[1]
2. Discussion
a. Method
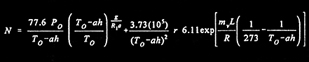
A systematic, step by step procedure was used, from basic analysis through final result, to quantify enhancement analysis at a level sufficient to confirm presently or previously observed phenomena, and then to deliver prediction results. The basis for enhanced tropospheric bending and ducting of radio waves is a decrease in the atmospheres refractive index, n, with height, above and beyond its normally observed decrease. This phenomenon is similar in nature to Snells Law and the bending of light waves from a surface of greater refractivity to a surface of lesser refractivity, with the slight difference being that changes in refractivity in the atmosphere occur relatively gradually until (for ducting) a rather abrupt boundary is encountered, in contrast to the sharp boundary that exists between two physical materials with different but essentially constant indexes of refractivity. The atmospheric relation of refractivity to measurable meteorological parameters as derived by Debye and Saxton (Bean and Dutton 1966), and simplified to a unitless expression containing two terms, is:
where N is the refractivity defined equal to 106(n - 1) in order to increase the scale factor, which otherwise would involve working with numbers much smaller than 1 in calculating the change in refractive index; P is the total atmospheric pressure of the air sample in millibars; T is its temperature (degrees K); and e is the partial pressure (in millibars) due to water vapor.
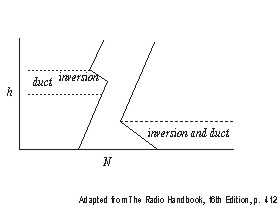
We first explicitly differentiated the equation for N with respect to height (see Appendix), the form of which is not generally available, to secure a ready understanding of enhancement and to substantiate previously observed characteristics (see, for example, Tilton 1968; Evans and Jessop 1976; Radio Society of Great Britain 1976). From the differentiated equation, we discover that enhancement in general (i.e., an increase in range brought about by a negative gradient in the refractive index above its nominal value in a standard atmosphere, which through scattering, causes signals to return to earth that would otherwise have been lost to space) occurs when there is a substantial tem-perature inversion with height, accompanied by a fairly rapid decrease of relative humidity (Fig. 1).[2]
 Fig. 1 - Click for details
Fig. 1 - Click for details
From a practical sense, enhanced con-ditions often occur due to regional subsi-dence, i.e., the sinking of air from a high pressure system meeting a moist lower layer, with best propagation often along a northeast to southwest path as a high pressure system slowly gives way to an advancing cold front. This type of enhance-ment generally peaks during the early evening hours to the early morning, where the suns thermal forcing (and thus atmos-pheric instability) is minimal. Radiational cooling (at night) can also be enhanced by a stable high-pressure system, and heating of the ground at the lowest layers in the morning can also form inversions and often enhancement until the effects of local mixing (night) or turbulence (day) become significant.
We then secured radiosonde data in tabular form, available from several sources on the World Wide Web, initially from the University of illinois in spring 1995, and the University of Wyoming and Purdue University thereafter. A virtually uninterrupted database was developed for February-October 1996, with data also secured for one-third of the month of January and two-thirds of the month for November and December. The format and data content of the databases at each site changed several times during the almost two-year period data was collected to April 1997. In addition, the Wyoming data was initially written for the Mosaic browser, as opposed to the others using Netscape; these difficulties were surmounted by modifying the data-collection software and the algorithm itself on an on-going basis.
Various methods are in general use to remove the systematic (i.e., normal) decrease in atmospheric refractivity with height, ultimately resulting in the popular selection of A, B, M, and N profiles, with the A, B, and M being modification of the basic N profile. Our choice in securing a general result was to simply utilize the N profile as is, which removes the effects of both station height and elevation. In general, inversion/humidity anomalies and their heights were detected using the tabulated data soundings and appropriate software was developed to calculate dN/dh, i.e., the basic difference of N at two levels on a level by level basis (and also over two levels at a time to detect any larger ducts), with h converted to appropriate p coordinates, a more natural (and practical) selection in the vertical dimension to facilitate rapid computation. In order to calculate dN/dP in a given section of atmosphere using the basic equation for N, variables such as partial pressure were calculated by determining relative humidity and using the Clausius-Clapeyron equation (the relative humidity, r, and several other parameters such as height, h, are presently given directly for every level in each station sounding, but were not initially provided).[4] The level and depth of ducts (if any) corresponding to the maximum value of -dN/dP calculated from the surface to initially 400 mb (now 700 mb) were then tabulated, with the physical depth of a duct approximately equal to 100 times that of the highest wavelength propagated. (See Radio Society of Great Britain 1976; the duct relation holds sufficiently accurate at heights of several kilometers, although the basic relation was initially derived for ground-based anomalies.) The minimum value of dN/dh required for superrefraction (ducting) is -157.[5] Of particular note with respect to the capabilities of the initial program was the detection and confirmation of ducting (i.e., an extremely sharp negative gradient of dN/dP that can cause signals to propagate as in a waveguide for long distances with little loss in strength) from Louisiana/Arkansas to Texas on 23 February 1996 on 6 meters (50 MHz), a rare event because of the very low frequency.
After developing the software for reliably detecting inversions and quantifying enhancements from a given sounding, we then proceeded to develop an algorithm to predict enhancements from the soundings using data provided by back analysis, which was in the form of published reports of previous openings, the raw data soundings previously compiled, and in some cases use of local surface maps to confirm or reject cases that were marginal. In many cases, enhancements that were ultimately confirmed as part of well developed systems were identified at the time of tropospheric enhancement from observations of (or direct participation in) comniunications between radio amateurs north to south, northeast to southwest, or east to west, ranging from Canada to Maine to Georgia to West Virginia, Ohio and Indiana. Of particular note is that the model initially indicated strong enhancement at several grouped, i.e., regional, stations for well entrenched systems, and this attribute was incorporated into the algorithm.
b. Model
 Fig. 2 - Click for details
The basic analysis tool (Fig. 2) for prediction is a two-leg model based on isolating con-ditions related to a high degree of atmos-pheric stability, a factor required for the formation of enhanced radio paths and ducts (see, for example, Bean and Dutton 1966). In the bulk of the tests, present conditions are compared to the conditions that existed 12 hours earlier, with I = 60, for example, the maximum number of sound-ings in a month containing 30 days, and M equal to the number of stations in the data set for that month. Thus, one leg performs a check of atmospheric persistence (small change in the lifted, K, totals-totals, and severe weather stability indices) for two continuous 12-hour measurements. This is followed by a check to determine if the pressure level is fairly constant at which the maximum change in potential tempera-ture with height (i.e., slope) is observed. The slope at each level of a sounding is one measure of subsidence or sinking of an air mass and thus is often a precursor to duct-ing (Jehn 1960; Evans and Jessop 1976). The usefulness of tracking potential tempera-ture (Jehns method actually calculates a related parameter, the potential refractive index) can be readily observed by differentiating the classic equation for potential temperature with respect to height, which indicates that the slope is proportional to the magnitude of a temperature inversion and a rapidly decreasing humidity gradient with height; precisely the same conditions that lead to ducting as indicated by the equation for dN/dP. If the pressure/slope condition is met at this stage of the program, the model returns a hard condition of predicted enhancement. The second leg of the model tracks the more dynamic characteristics of the atmosphere, including a lifting out, or rising boundary layer (as presently implemented, this part of the program is actually common to the first leg); the CAPE stability index; the variation in a stations 500 mb thickness over three successive data sets; and the change in slope with respect to time, consistent with rules that determine if the slope is fairly constant or maintained within certain limits. If relative stability is indicated, the model predicts enhancement.
In summary, the model collects at least two successive data sets from a given station, during which time the program determines if a duct presently exists, determines its height, calculates from the duct thickness the highest wavelength (in centimeters) that can be propagated (Radio Society of Great Britain 1976), calculates the maximum slope between any two successive levels (1st level potential-temperature slope), and between first and third levels (second level potential-temperature slope, to detect the possibility of larger boundary layers), and indicates a P, for persistence, if conditions are forecast to remain stable over the next 12 hours. At least three successive data sets for a given station are required for the second leg of the model to forecast the possibility of an enhanced radio path, or in the limit, a duct, both indicated by D. The issue with respect to predicted ducts that apparently do not occur (or may have occurred, but could not be detected at the time of the next sounding) are addressed in the final statistical analysis, which determines duct formation based upon group/regional conditions and back analysis.
The model presently carries out its analysis up to 700 mb (although ducts have been observed to reform briefly at heights to 500 mb as they lift out to make way for trailing low pressure systems). The model, moreover, can accommodate virtually any physical condition that might be important in present or future study, such as setting a maximum level at which a duct can rise and still reform at a lower level. We can also simplify analysis by eliminating the printout of surface ducts, which can form simply because of local radiational cooling and not necessarily because of a larger-scale system, which is more likely to provide extended communications over land.
Due to the basic nature of typical meteorological models, which generally contain non-linear components and in essence carry a rather large number of variables whose values are often dependent on each other, constants for certain variables in our simplified model could not be theoretically derived, but were selected based often upon observational data. In that context, great care was taken to select constants striking a realistic balance between that which is reasonable with the models basic workings, and previous observations. We adopted, for instance, the condition that circumstances suitable for enhancement exist if lifted, K, totals-totals, and severe weather (SWEAT) indices have all held within 3 of their values 12 hours previously, these relatively constant parameters
 Fig. 3 - Click for details
having from inspection of the soundings and post-analysis contributed to observed duct wavelengths in the range of 100 to more than 300 cm.[6] This, combined with the fact that wavelengths at a minimum of 100 cm at the time of a sounding are a direct indication of openings in the Amateur band at 432 MHz (70 cm), virtually confirm an opening in the 222 MHz Amateur band (the so-called 1-1/4 m band, actually about 135 cm), and fre-quently deepen and lead to an opening as low as 144 MHz (200 cm or so), as has been observed frequently, admittedly has resulted in the development of an algorithm with a "running start" for predicting possible openings at the lower
frequencies (Fig. 3). This "running start," however, is balanced by observational truth, owing mainly to the buildup of enhancement layers at a rate far faster than the traditional textbook literature indicates.
Fig. 3 - Click for details
having from inspection of the soundings and post-analysis contributed to observed duct wavelengths in the range of 100 to more than 300 cm.[6] This, combined with the fact that wavelengths at a minimum of 100 cm at the time of a sounding are a direct indication of openings in the Amateur band at 432 MHz (70 cm), virtually confirm an opening in the 222 MHz Amateur band (the so-called 1-1/4 m band, actually about 135 cm), and fre-quently deepen and lead to an opening as low as 144 MHz (200 cm or so), as has been observed frequently, admittedly has resulted in the development of an algorithm with a "running start" for predicting possible openings at the lower
frequencies (Fig. 3). This "running start," however, is balanced by observational truth, owing mainly to the buildup of enhancement layers at a rate far faster than the traditional textbook literature indicates.
Fig. 3 - Click for detailsc. Accuracy and verification
Various atmospheric anomalies that inhibit or delay enhancement at a given station, and local effects of land and sea breezes, make it difficult if not impossible (given the sparsity of two-per-day soundings) to confirm with 100 percent certainty an enhancement at a given station from the program printout alone. Simply stated, the formation of enhanced radio paths or ducts at any given station or over a given area does not follow a strict time constant. Paths that may have been predicted 12 hours ago can form well within 12 hours, temporarily weaken near the time of the sounding; or may be weak but build at the time of the sounding (by far the most frequently observed phenomenon). They may also take more than 12 hours, but less than 24, to form and entrench. The fifth alternative, of course, is that the path may be fully established within 12 hours and be present during the subsequent sounding, as reflected in the program output. Thus, defining and determining numerical accuracy in an objective and realistic manner becomes somewhat complicated. It is, however, reasonable from the above scenarios to declare that for every enhancement that appears on a printout following a prediction for it, there is at least one enhancement that does not appear at the time of the sounding but has occurred or is forming by the time of the next sounding, or ultimately will occur before the following sounding. The algorithm as written, in fact, predicts for each month slightly less than twice the number of significant enhancements that actually appear (defined to occur when the calculated wavelength is 100 cm or more in the printout 12 hours later). These considerations translate to a condition whereby at a given station, an average of 42 percent of all enhancements at 100 cm over the entire year are directly and correctly predicted as confirmed from the printout alone, and again, with this situation implying that there may be an equal number appearing shortly just before or after a sounding.[8] This condition ultimately leads to the realization that a relatively large number of stations over a wide area are required to determine the collective chances for ducting, and are essentially needed to confirm such ducting. This further leads us to implement rudimentary station cluster analysis.
More specifically, the properties of an air mass generally prevail over a significant area, and so logically provide homogeneous atmospheric conditions, allowing development of suitable criteria to determine the regional accuracy of the model. Indeed, the relatively large distance between sounding stations would expectediy limit the prediction techniques to large scale systems. In that context, regional grouping of stations, and the technique of back testing (or back analysis), complemented by observations in real-time where practical, were employed to yield predictions that could more practically be confirmed.
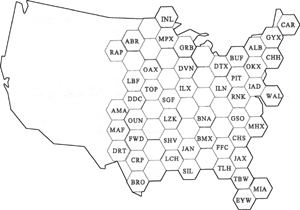
In this case, each of 47 stations used in the study comprising the eastern US area was placed in an interlocking hexagonal grid arrangement, with its location in the grid corresponding to the approximate geographical positions of the stations to each other (Fig. 4). The hexagonal scheme was selected to enhance both the visual representation and the interrelation of ad-jacent stations with respect to radio path distances (adjacent hexes indicate two stations separated on average by approxi-mately 400-500 km, or 250-300 miles), and at the same time more clearly identify sparse areas of radiosonde coverage. One minor drawback of the skewed hex represen-tation is that it creates slight inaccuracies with respect to the actual geographical po-sitions of nearby stations, and some de-gree of distortion for stations separated by great distances, but these drawbacks in physical representation have no bearing on prediction analysis.
d. Determining accuracy criterion
In order to define the accuracy of the model, we first sought a basic rationale to ascertain and justify the minimum number of stations that might be required to form the basis for reliable prediction. To address the problem in the simplest possible manner, we determined the probability that n stations under the influence of the same air mass would fail to predict an enhancement where one was certain to occur.
If the models overall prediction accuracy were to be 50 percent (P = 0.5),[9] we might conclude that a minimum of five stations having no skill are required, since the probability of all being incorrect would fall to sufficiently low levels, the probability for the group being P = (0.5)5 = 0.032, or slightly greater than three chances in 100. Given a "no skill" probability of 0.5 for the model, the chances of 5 stations predicting the duct correctly as a group might of course be considered to be the same, 0.032. However, given that the model was derived on a step-by-step basis to increase prediction efficiency beyond "no skill," we expect the prediction model to fare somewhat better. Thus we hypothetically assigned a probability of 0.6 (somewhat greater than no-skill) to each station denoting that "an enhancement is predicted" given that an enhancement ultimately occurs. This value in effect initially creates a situation somewhat better than a "no-skill scenario," and perhaps might allow the use of less than five stations.
Given that an enhancement will develop, the conditional probability that it will not be predicted by a given observing station is P = (1 - 0.6) = 0.4. The probability of, say, four stations as a group, i.e., under the influence of the same air mass, failing to predict the enhancement is then P = (0.4)4 = 0.026, or slightly less than three chances in 100. Thus we assume four stations could be used. Subsequent probability analysis based on a total number of four, five, and six stations to determine the exact number of stations required to correctly predict a maximum percentage of enhance-ments yielded three to four for a four-station grouping if the enhancement prediction capability is sufficiently high (P = 0.6 - 0.8), four stations in a five-station network, and five stations in a six-station network (same range of P). Ultimately, we adopted five stations as the standard for the model, with this number essentially defining the minimum areal coverage of the enhancement sought.
We thus initially concluded that a prediction accuracy of 60 percent or higher could be secured, and that a relatively widespread enhancement would be deemed correct, if at least five contiguous stations in the hexagonal grid had, after analysis 12 hours previously, been assigned a D by the program algorithm (or a P if enhancement existed at the time of prediction), and an enhancement or duct was subsequently observed or otherwise confirmed in the same general area 12 hours later. Practically, the prediction was also deemed correct if an enhancement was ultimately confirmed in at least 5 grids assigned a D, while allowing for the condition where up to one nonoccupied grid or station could serve as a bridge to other Ds on the other side of the documented cluster. This last condition was implemented to account for the frequently observed occurrence whereby changing "duct" heights due to turbulence, in combination with given geography, are such that communi-cation is not always possible between adjacent stations for the duration of an opening. Implicit in defining accuracy is the understanding that this model was developed as a first step, solely to predict the propensity, or tendency, for extended radio communications between two locales, especially at 144 MHz. Prediction and duration of the exact radio paths, individual duct thicknesses and heights, and especially signal strengths were not addressed by this model simply because the power, siting, and antenna capabilities of individual stations vary greatly.
3. Results
The technique of back analysis was used to confirm the accuracy of the model. Back analysis uses an observational source (QST, 1946-present), the existing data set of actual soundings, and in cases of marginal results, daily surface weather maps. Generally the back analysis procedure as it relates to the published source compares duct predictions for a given time and a set of stations for days in month 1 with ducts that are actually observed by radio amateurs throughout the country at that time, and are published in month 4. This source has documented the larger openings over the years fairly well, although the source is known not to be complete for four major reasons: not all participants in VHF/UHF activity report their results; various extended paths in the south occur fairly often year round and have come to be regarded as commonplace and thus are not reported; openings occur but are not observed for lack of Amateur activity on a given band at a given time; and finally, available publishing space is not limitless (Pocock 1996). All of these factors contribute to the widespread belief, virtually confirmed by our existing set of actual data soundings and observations, that there are far more VHF/UHF openings than reported. Fifteen major events were reported in QST during 1996 (including some multiple-day events), with virtually no reports of VHF or UHF tropo openings published during four months (March, April, June and July). Using the aforementioned algorithm, our model was successful in post-priori prediction of 12 of the 15. Again, of particular interest is that virtually all reports note a substantial peaking of these events several hours to either side of the time of a sounding, which confirms the existence of quick-building enhancements that may not be present at the actual time of the sounding. Moreover, our model indicated the existence of upwards of 70 such events for the year, for which data existed for analyzing 67 of them. The model was successful in predicting 48 of these correctly using our aforementioned definition of accuracy, for an accuracy of 71 percent. Of the 19 predictions that were incorrect, 9 involved enhancements that apparently did not form or were in an unknown state of development (fewer than five stations in a cluster, and/or weak enhancement, and no confirmation of enhancement could be secured from any source); 9 involved predictions that were late (enhancements basically had already formed at the time of prediction), and 1 involved an enhancement in an area sufficiently removed from the area that enhancement had been predicted for. Note carefully that we defined accuracy in terms of actually detecting the onset of a widespread enhancement (and thus assuming the likelihood of enhancement) at UHF; and in terms of the propensity, or tendency, for enhancement to occur at VHF (based on data of five or more clustered stations showing a wavelength of 100 cm or more, we infer an accuracy at these frequencies of approximately 60 percent). Thus, consecutive multi-day openings were classified as one event, not a succession of individual events. Tabulating results along the latter lines, although justified from a technical standpoint in performing 12-hour predictions, would have boosted the models "accuracy" in a way that in our opinion would have implied an artificial measure of success.
4. Improvements
In a significant number of cases where a given prediction was deemed incorrect, enhanced conditions had formed by the time a prediction for the enhancement could be made (i.e., the prediction was late, a "D" appearing on the printout of a station in a given cluster at the time of the first enhancement instead of 12 hours previously). The tracking of slope as per Jehns (1960) method, which essentially quantifies the amount of subsidence, provided results somewhat in contrast to our traditional belief. This was perhaps boosted by an implied notion in the various literature (Kerr 1951; Bean and Dutton 1966; Evans and Jessop 1976; Radio Society of Great Britain 1976), that subsidence-related buildup and decline of enhancements/ducts follows a relatively slow, well-established time constant taking several days. Unfortunately, many buildups apparently happen in less than 12 hours, and this factor is likely to be the major stumbling block in developing a better model for the foreseeable future. An increase in the number of soundings per day would perhaps overcome this problem, although it is not clear that soundings carried out during mid-day hours would be of benefit. For example, various stability parameters upon which this program relies would more than likely change above and beyond their apparent "quiescent" values at dawn and dusk, and a different technique would likely be required to analyze the radio atmosphere if midday soundings were to be utilized.
Overall, the model provides excellent results for most of the stations observed, considering the database, and very few modifications to the basic program have been required to meet the basic objectives initially outlined. Not considering the shortcomings of the database, there is yet room for improvement. First, the model does not appear to be particularly adept at predicting surface ducts, in all probability because the lifted, K, totals-totals, and SWEAT indexes are generally indicators of conditions higher up. In addition, surface layers are only a small fraction of the total integrated mass of air as factored in by the CAPE index for stability Underlying this basic consideration is that the model does not attempt to directly predict ducting due to radiational cooling or low-level advective warming, which can be intense (Bean and Dutton 1966) over a relatively short range, but of itself may not provide the longer path enhancements (up to a few thousand kilometers) sought unless the enhancement forms over water, such as off the east coast of the US. Thus, surface enhancements and ducts have not been considered in this model, although they can be detected at the time of a sounding with the software as it now stands.
The most significant alteration to the basic algorithm addresses stations located in the northern parts of the country, where elevated ducts apparently do not often form, and appear somewhat harder to predict, perhaps due to the generally colder atmospheric temperatures. There, we find that upper-air winds from the southerly directions may play a part in enhancement. More specifically, upper-air enhancements at stations in the north apparently have a greater chance to form if there is transport of warmer air, during which case winds must veer with height (i.e., direction changes clockwise with height). Such upper-air winds, of course, might generally be regarded as a destabilizing force due to the added moisture they often bring, which might tend to dissipate duct formation. However, the absolute value of moisture brought in at the upper levels appears thus far not to be a major factor in destabilization. At this time, the major contribution of veering winds appears to be advection of wanner air at the upper levels which, from basic considerations, is a primary driver in increasing the magnitude of dN/dP. Thus for the moment, the veering-wind condition has been retained in the model pending further investigation.[10]
A third category involves stations surrounded by water (e.g., Hawaii and Bermuda), west coast stations along the water, and stations for which duct prediction cannot be meaningfully linked due to the distance between them or natural barriers (Hawaii to west coast, west coast to mountain states). The bulk of these stations are not in the primary geographical area of concern, and thus do not present a problem at this time. Initial data for stations such as Bermuda; Hilo and Lihue, Hawaii; and Oakland and Vandenburg, California indicate that local sea breeze and land breeze effects may also be a complicating factor in masking the conditions that indicate future ducting, or otherwise make reliable prediction impossible. In addition, reports of communications between these stations and others in mountainous regions are either rare or are not reported with regularity, and so cannot be readily confirmed.
Other general areas whose solution would improve accuracy include a-priori prediction of the limiting values of various parameters for an impending enhancement, which may or may not be possible given the information contained in the basic database. These include forecasting the maximum value of slope to aid in determining the time scale of a duct formation or decay. Increasing the number of soundings, as mentioned previously, and the arrival of satellite systems having sounders that enable vertical depiction of moisture and temperature to provide daily long-term monitoring of the atmosphere, would at least appear initially to be the most significant factors in improving the propagation prediction accuracy.
5. Conclusion
Real-time, upper-air sounding data now readily available on the World Wide Web provide a sufficient number of indicators for predicting likely tropospheric enhancement in the UHF region due to very wide ranging, subsidence-related conditions, and the propensity for enhancement at VHF. While it may be argued that prediction accuracy as quoted can readily be exceeded simply by inspection of surface weather maps, we believe this model is a worthy tool for providing a more systematic analysis, and perhaps for securing a more accurate analysis with respect to defining exact areal extent. Despite the sparsity of data (two soundings per day), the relatively great average distance between adjacent stations, and the simplicity of the method, the accuracy of such a technique (as we define it) using available back analyzed data is as high as 70 percent on a 12-hour forecast for 432 MHz openings, with an implied accuracy of about 60 percent for 144 MHz openings, and an accuracy somewhere in between for 222 MHz openings. The greatest difficulty in prediction appears to be fast building enhancements that occur before the prediction for those enhancements can be made. In general, the model clearly is most useful for the larger scale systems, and the results more than adequate for radio amateurs for advance notice of communications beyond normal distances. This basic model may also be useful to users concerned with disruption, or undesired extension (especially in-theater or in a battlefield environment) of the normal radio path, such as the military; and perhaps commercial interests who must establish reliable short-path radio links.
Acknowledgments
Thanks are due Michael Douglas of the NOAA/National Severe Storms Laboratory for discussion concerning the aspects, advantages, and practical limitations of the aforementioned model, and to Ken Goss at Vaisala (Woburn, MA) and Maury Friedman at VIZ (Philadelphia, PA) for providing valuable practical information concerning the sensor specifications and operational characteristics of radiosondes in use today. We are also indebted to David B. Mitchell and Margaret Vezza for their review of the manuscript. This program may ultimately be made available in freeware or shareware. During the next year, propagation prediction information at least 8 to 9 hours in advance of projected openings will be made available in graphical form at a suitable web site.
Authors
Vincent Biancomano received a B.S. in Electrical Engineering from Fairleigh Dickinson University (75) and an M.S. in Meteorology from Rutgers University (89). He has worked in an engineering capacity with Bell Labs and Perkin Elmer, and as a managing editor for the Institute of Electrical and Electronics Engineers (IEEE). Presently, he is a contributing editor for EE Times, the leading news-paper for engineers and technical management, covering power and fiber optic communications technologies. He is a member of the NWA, the AMS, and IEEE.
Scott Leyshon received his A.S. in Engineering Science from the County College of Morris in New Jersey. He has served over many years as a consultant in the computing area for various industrial corporations, including BASF, Bell Labs, and R-Way International, which performed contract work for the Jet Propulsion Laboratory.
References
Bean, B.R. and E. J. Dutton, editors, 1966: Radio Meteorology, 248, Central Radio Propagation Laboratory, National Bureau of Standards monograph 92, Boulder, CO.
Ducting Climatology Survey, 1992: Naval Command, Control and Ocean Surveillance Center, Research, Development, Test and Evaluation Division, Code D883, San Diego, CA.
Evans, D.S. and G.R. Jessop, editors, 1976: VHF-UHF Manual, third edition, 2.2-2.12, Radio Society of Great Britain.
Hull, RA., 1935: Air-mass conditions and the bending of ultra-high frequency waves, QST 19, June, 13-18. Initial work first reported in QST 18, October, 9-13, 106, American Radio Relay League.
Jehn, KH., 1960: The use of potential refractive index in synoptic scale radio meteorology, J Meteorology, June, 17, 264.
Kerr, D.E., 1951: Propagation of Short Radio Waves, McGraw-Hill, New York, NY.
Marcus, S., and William D. Stuart, 1981: A Model to Calculate EM Fields in Tropospheric Duct Environments at Frequencies Through SHF. UT Research Institute, under contract to Department of Defense, Electromagnetic Compatibility Analysis Center, Annapolis, MD.
Pocock, E., 1996: Editor, The World Above 50 MHz, QST Magazine, The American Radio Relay League, personal communication.
QST magazine, 1946-present: The World Above 50 MHz, monthly feature. The American Radio Relay League.
Radio Propagation Over Terrain Model 1996: Naval Command, Control and Ocean Surveillance Center, Research, Development, Test and Evaluation Division, Code D883, San Diego, CA.
Radio Society of Great Britain, 1976: Radio Communication Handbook, Vol.2, fifth edition, 11.20-11.21.
Tilton, E.P., editor, 1968: The Radio Amateurs VHF Manual, 11th Edition, 17-18. American Radio Relay League.
Appendix
Derivation of Refractivity Equation for Ducting Phenomena
The refractivity of a given section of atmosphere is given by:
where P is the pressure (millibars), T is the absolute temperature, and e is the partial pressure (millibars) due to water vapor. Consider a constant-lapse-rate atmosphere in which T = To - ah, where T is the temperature at height h, To is the surface temperature, and a is the lapse rate (K/km). The pressure distribution in a constant-lapse-rate atmosphere is given by:
where Po is the surface pressure, g is the acceleration due to gravity, and R1 is the gas constant for air. Expressing e in terms of relative humidity and the Clausius-Clapeyron equation, we get:
where r is the relative humidity, mv is the molecular weight of water vapor, L is the latent heat of evaporation for water, and R is the universal gas constant. Differentiating N with respect to h, then introducing Kroneckers delta function to implement an abrupt change in lapse rate, da/dh, and humidity dr/dh at height x, while evaluating the equation in height increments of j, we have:
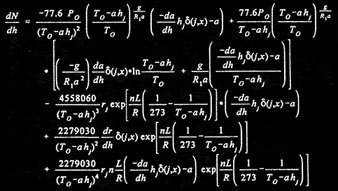
where n = 4.186 mv to preserve correct dimensional-unit analysis, the change in relative humidity from layer to layer is assumed much smaller than the discontinuity introduced at height x, and where the result is illustrative. We set g = 980, R1 = 28.7, R = 8.31, L = 597, and n = 18(4.186). Let j = 1,2,...18 (hundreds of meters), h = j/10, x = 15 (1.5 km).
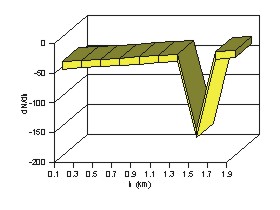
Now consider To = 285, r = 1-0.015j, a =7, -da/dh = 20 (an increase in temperature of say, 2 C in 100 m), and dr/dh = -3 (representing a drop in relative humidity from, say, 80 to 50 percent in 100 m), with the profile for relative humidity and the value of lapse rate providing reasonably representative numbers for a typical sounding in the spring to fall months. The resulting curve (above) shows unstratified (nominal) conditions until the point of discontinuity at 1.5 km. The refractivity and the magnitude of a duct at a given level are very strongly proportional to the humidity gradient and strongly proportional to temperature and lapse rate.[11] The absolute value of relative humidity has a moderate effect on refractivity, and the surface pressure negligible effect.
Supplementary notes
[1] The rationale for following this practice today is much less persuasive. Over 60 years the issue has evolved from lack of transmitting and receiving equipment for the higher frequencies, to lack of activity despite the availability of equipment. Operating tradition, however, has changed little. Most UHF bands today are fairly well populated. More users are generally knowledgeable of the increased likelihood of the UHF, versus VHF, frequencies for tropo-related communication. With more stations equipped to generate substantially greater transmitting powers (to hundreds of watts), increased awareness of antenna design appropriate to the propagation mode, wider installation of radio beacons, and the emergence of early-alert (Internet-based) reflectors, the existing tradition may soon change.
[2] We selected relative humidity, versus more fundamental parameters such as absolute humidity or the mixing ratio, because of its familiarity to general users as well as the possible advantages it might afford in analysis. One drawback in analysis is that relative humidity is a function of temperature. In any case, for typical ducting the given moisture variable decreases, not increases, with height. Over time, the latter belief has surfaced apparently from observations of raindrop-scatter enhancement at UHF and above, a different phenomenon.
[3] We incorporate our observational data in this simplified schematic to depict enhancement as an incremental bending process. This approach is in contrast to the typical textbook treatment, which characterizes enhancement as an extension of scattering up to the theoretical limit of about 500 miles (for stations at sea-level). Our data indicates enhanced (non-ducting) conditions occasionally give rise to communications over 600-700 miles (well beyond that expected by the classical model even taking into account station elevation), and this data appears to support the existence of several complex modes, some described in the more recent literature. For ducting, analysis is further complicated because, except under special circumstances, few stations are physically "in the duct" but rather couple energy to it. In this context, the radio launch angle and the height of the duct determine the effective coupling.
[4] The vapor pressure, e, can be more readily determined from the mixing ratio w ≈ 0.622 e/P, where P is total pressure. Owing to earlier considerations in developing the model, however, we initially did not utilize the w sounding data.
[5] The value of dN/dh required for so-called extreme superrefraction, which can give rise to ducting, is essentially independent of height (see Bean and Dutton, p. 138). The minimum value required for superrefraction (enhancement) is -80 in the 700-850 mB range (p. 248). Ducting is often described as a "trapping" phenomenon, i.e., with waves propagated by multiple internal reflections between the duct's upper and lower boundaries. The boundaries of a surface duct are essentially defined by the depth of the temperature inversion, but that is not necessarily the case for an elevated duct (see figure, below).
[6] More specifically, a scaled, indexed version of the SWEAT index, which ultimately proved to be too restrictive for our objectives. Present versions of the model employ the Showalter index.
[7] The 100:1 ratio is intended as a visual memory aid only: If, for example, d = 500λ2/3 (RSGB, 1976, p. 11.8), where d is the duct depth and λ is the operating wavelength in centimeters, then d/λ is 59 at 6 meters, 85 at 2 meters, 97 at 135 cm, and 121 at 70 cm.
[8] This empirical relation gave rise to our goal of developing a yes/no prediction model for enhancement suitable for general application. While we acknowledge the apparent incremental nature of enhancement, as noted in [3], we are uncertain that knowledge of such levels is useful for predicting significantly extended communications range.
[9] More clearly denoted, the probability, Pr , versus P, which denotes "persistence" in the program printout; also note we define "no skill" in somewhat restrictive terms.
[10] We have yet to fully investigate the importance of temperature, T, on the physical mechanisms at work in duct formation, particularly as it relates to depth. "Tropo" in general appears to occur much less frequently during cold, dry conditions; observers often conclude the reason is primarily due to lack of moisture. Enhancement and particularly ducting, while unlikely under these conditions, can occur; often, the determining factor is the magnitude of the change in absolute or relative humidity in a given layer.
[11] That is, T (with T having a greater effect as it rises) and da/dh.
To evaluate dN/dh in its step-function equation form, determine the individual contributions of the equation's wet and dry components, and then sum the two. First determine the contribution of the dry components (first two terms) by setting r and dr/dh = 0, and -da/dh = 20 (the temperature inversion). Next, find the contribution of the wet components (last three terms) by removing the two dry terms from the equation, and resetting r and dr/dh to their original values and -da/dh = 0. This particular example yields a raw indication of dN/dh (i.e., an overestimate; the value yielded from reconstructed layer-by-layer data of a sounding that meets the example would be in the -120's range), demonstrating a rather severe test for the equation because of large step changes in tem-perature and relative humidity in a region where vapor pressures become low. Most frequently, the results will agree to within 5 or 6 percent of calculations secured from a typical "well behaved" sounding; often the two will be in virtual agreement.
(Supplement added August 2002)
(Additional notes added September 2005)
(Additional notes added September 2005)